Description:
Storing energy from intermittent renewables, such as wind and solar, is one of the most pressing challenges we face for enabling a sustainable civilization.
To efficiently allocate resources, researchers and administrators need a high level understanding of the field of energy-storage.
During my summer with the Department of Energy, I used natural language processing techniques to extract insights from tens of thousands of scientific abstracts
relating to energy-storage, and I created interactive visualizations for exploring my results.
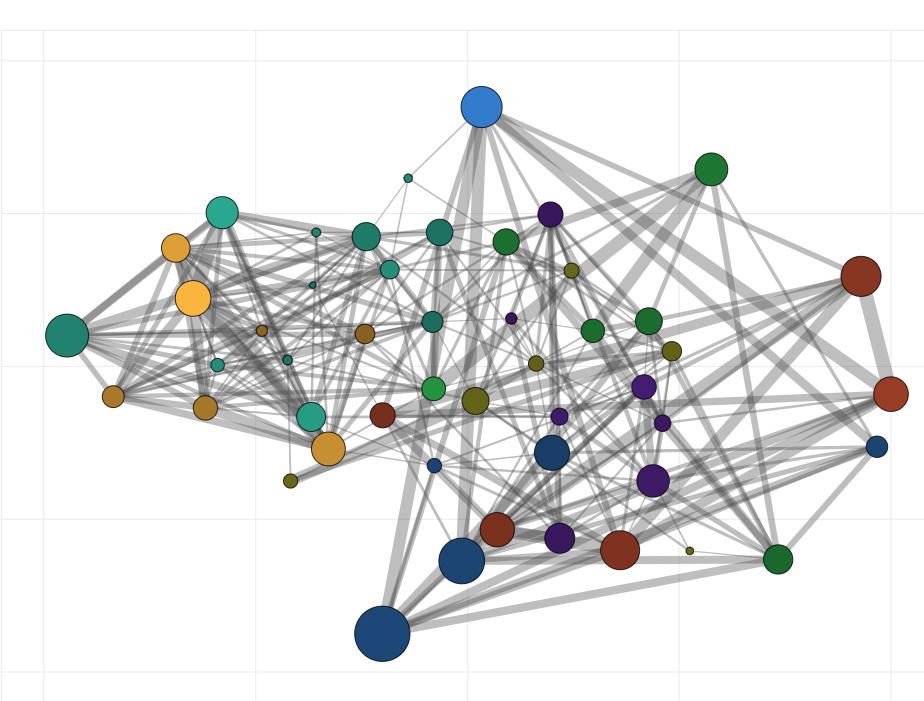
For my first visualization, I used LDA to do topic modeling of the energy storage literature and created an interactive graph that allows you to explore topics and their intersections.
For the second visualization, I used Word2Vec to create word vectors from prevelant terms in the data.
I then used tSNE to project these vectors to a 2D plane for interactive visualization. This tool also allows users to do vector math with the word vectors (more info on the website).
Interesting results or findings:
We found that the model generated topics that were sensible and specific, and that the community detection made groupings that were interpretable and interesting.
Some topics were technology-focused such as topic 49 which is centered around electric vehicles.
Other concepts were more abstract such as topic 23 which had more to do with grid optimization and energy management.
The connections between topics were also sensible. The connection between topics 49 and 23 for instance involves vehicle to grid and grid to vehicle research.
The Word2Vec visualization was a little bit less intuitive, but the similar words all seemed very reasonable.
For example, the closest words to "solar" are "sun, photovolta, sunlight, parabol_trough, pvt, csp, plant, flat_plate, geotherm, and panel".
The vector math took some time to build intuition for, but also produced meaningful results.
For instance, COST - EFFICI + CYCL = LONG_TERM which makes sense because the efficiency of a battery is to the cost as the cyclability is to the lifetime.
More specific results can be found on the website.
Challenges:
The biggest challenge of this project was familiarizing myself with the number of different libraries and tools involved.
I had previously never worked with Gensim, Bokeh, or Javascript, so quickly familiarizing myself with these tools enough to complete this project
in ten weeks was a large and sometimes very frusterating task. Additionally, the data cleaning process is imperfect. Not all punctuation was removed,
and there are still some non-English papers.
Skills:
Latent Dirichlet Allocation (LDA), Word2Vec, Louvain Community Detection, tSNE, Python, Bokeh, Javascript, html, css, Data Visualization, Visual Studios, GitHub
Code:
Project Website:
Energy Storage Website (serves as writeup as well)
Description:
I collaborated with a partner to create and compare two models that classify the MAGIC Gamma Telescope (MAGIC) dataset.
The telescope records partical showers which are caused by high-energy gamma rays or by hadron rays.
The goal is to classify the telescope's numerical representation of the shower as either gamma or hadron caused.
We first visualized our data to look for correlating variables and the underlying distributions of our variables.
We then preprocessed the data which involved normalizing attributes and splitting the data into a test set and training set.
We chose to build a Naive Bayes model as our baseline, and then went on to use a Support Vector Machine.
Model performance was evaluated using the area under the ROC curve.
Interesting results or findings:
The Naive Bayes model had an area under the ROC curve of 0.78 (with 1 being a perfect classification).
The Support Vector Machine model had an area under the ROC curve of 0.92.
We believe that the SVM was the better model in this case because Naive Bayes assumes that variables are independent, whereas our dataset showed some correlated variables.
SVM on the otherhand does not assume independence ann works well in high dimensions.
Challenges:
One point of confusion was that more advanced pre-processing methods seemed to decrease performance.
We are still not entirely sure why this would be, but it may show that sometimes manipulating the data too much may interfere with the model's ability to work with the data.
Skills:
Sueprvised Machine Learning, Classification, Predictive Modeling, Naive Bayes, Support Vector Machines, Sci-Kit Learn, Pandas, Jupyter notebook
Code:
Magic Datamining GitHub
Writeup:
Magic Datamining Writeup
Description:
In Summer of 2020, I did a research fellowship with the Xu Machine Vision Lab at University of Rochester.
I designed and implemented a machine vision pipeline for locating multiple objects in an image described by an input sentence.
The input is an image and a sentence describing one or more objects in the image.
The output is a set of bounding boxes around the target objects.
Visual grounding has been done for single targets, but not yet for multiple targets.
I generated a new synthetic data set with mutliple targets and modified the Language-Conditioned Graph Network (LCGN) by Hu et al 2019 to do visual grounding for multiple instances instead of just one.
I then designed an implemented a new approach that looked at sets of items holistically instead of evaluating each item separately.
At the end of the summer, I presented my work to the CS faculty at University of Rochester.
Interesting results or findings:
Our initial model had a top accuracy of 0.829, and a bounding box IOU (50% or greater overlap) accuracy of 66% which is competative with state of the art single instance models.
Our second model had a top accuracy of 0.378 and a bounding box IOU accuracy of 0.284. This model has a different training and testing approach, and we feel the low accuracy might be due to the testing approach
which uses beam search to find the most probable sets.
Challenges:
The biggest challenge was learning how to use vectorization to optimize code runtime. It took some time and effort to learn how to conceptualize tensors
with seven or eight variables and avoid using for-loops.
Another issue I ran into was that my data was unbalanced so there were far more ground truth negatives than positives.
I had to adjust the weights of the loss function and modify the evaluation metric to account for the imbalance.
Skills:
Supervised Natural Language Processing (LSTM), Convolutional Neural Network (CNN), Pytorch, Python, CUDA and GPU computing, Vectorized computation, remote computing on a Linux cluster,
Multi-layer perceptron, vim, functional programming, modifying and working with someone else's code, surveying machine vision literature, presenting research,
planning, organizing, and executing a research project.
Code: Visual Grounding GitHub
Writeup:
Visual Grounding Writeup
Description:
I created an AI to play Checkers against a human opponent using state space search and the heuristic minimax algorithm.
The game is printed in the console where the human player makes a move by typing the start and ending locations of a piece.
The new board is printed after each move.
The program keeps track of the state of the game including the location of each piece, which player each piece belongs to, which pieces are kings and pawns, and which player's turn it is.
The AI checks all possible actions and makes a queue of possible states resulting from these actions.
It checks if the current state is a terminal state and checks the utility of the terminal state.
It then uses the heuristic minimax algorithm with a cutoff to determine the move the yields the highest utility. (if draw: utility = 0, if computer wins utility = 1, if human wins, utility = -1)
The heuristic involves a weighted difference of the computer's pieces eand the person's pieces.
The game runs until someone wins or there is a tie. I'm not particularly good at checkers, but the AI never loses.
Interesting results or findings:
There weren't necessarily interesting "results" for this project, but it was enjoyable, gratifying, and fun to play.
Challenges:
The most difficult part of this project was checking for all possible actions. For the assignment, a chip must make the longest possible series of captures available.
When searching for possible moves, I had to keep track of the longest series of captures and clear the queue if I found one that was longer. Checking all the possible moves took
required me to very abstractly conceptualize the board and to think through all possible scenarios.
Skills:
Object oriented programming, Heuristic Minimax Algorithm, Learning a new programming language (this was my first project in Python!)
Code:
AI Checkers GitHub
Description:
I built a pipeline using MATLAB for processing a massive neural time series data set and ran comparative analysis on neural properties in different brain areas.
The data was in the form of a time series recording the time at which monkey neurons spiked during an attentional task.
First I separated the series of time stamps based on the trial number, the experiment condition, the brain area, and the electrode.
Then I mapped the distribution for how much each individual neuron would fire in response to seeing movement in different directions.
Then I ran population analysis on the neurons in different brain areas and compared the parameters of their firing distributions.
Interesting results or findings:
I found that the selectivity and response strength of neurons decreases as information travels up the visual hierarchy.
There were no significant difference between areas MT and MST (the lowest level areas I studied),
but there was a significant difference between each of the following brain areas (LIP and PFC)
Challenges:
For this project I had to learn MATLAB and also learn a great deal of statistics I was unfamiliar with.
Neuron tuning curves are a form of circular data (0 degrees and 360 degrees are the same), and so I researched and found the von-mises distribution
which allows you to apply a normal distribution to circular data. I also learned about some non-parametric statistical methods.
Skills:
MATLAB, data analysis, data visualization, statistics, von-mises distribution, Kruskal-Wallis non-parametric ANOVA test